Overview
About half of what lands in an Ethereum block was never in the public mempool. Not a rumour, not a paper from 2023. Half of the block that landed twelve seconds ago, and half of the next one.
Here is the short version of how Ethereum is supposed to work. You sign a transaction and broadcast it. It lands in the mempool, a waiting room every node can see, where it sits among tens of thousands of others until a block builder picks it up. Anyone can watch that room. That is the whole point of it: the chain is observable before it is final.
Except a growing share of transactions skip the room. They go straight to a builder through a private relay, inside a bundle, or as order flow that was sold before it was public. The first time anyone sees them is when the block does. Everyone in the space knows this happens. I wanted to see it happen, block by block, at the size it actually is. So I built an instrument for it.
The instrument
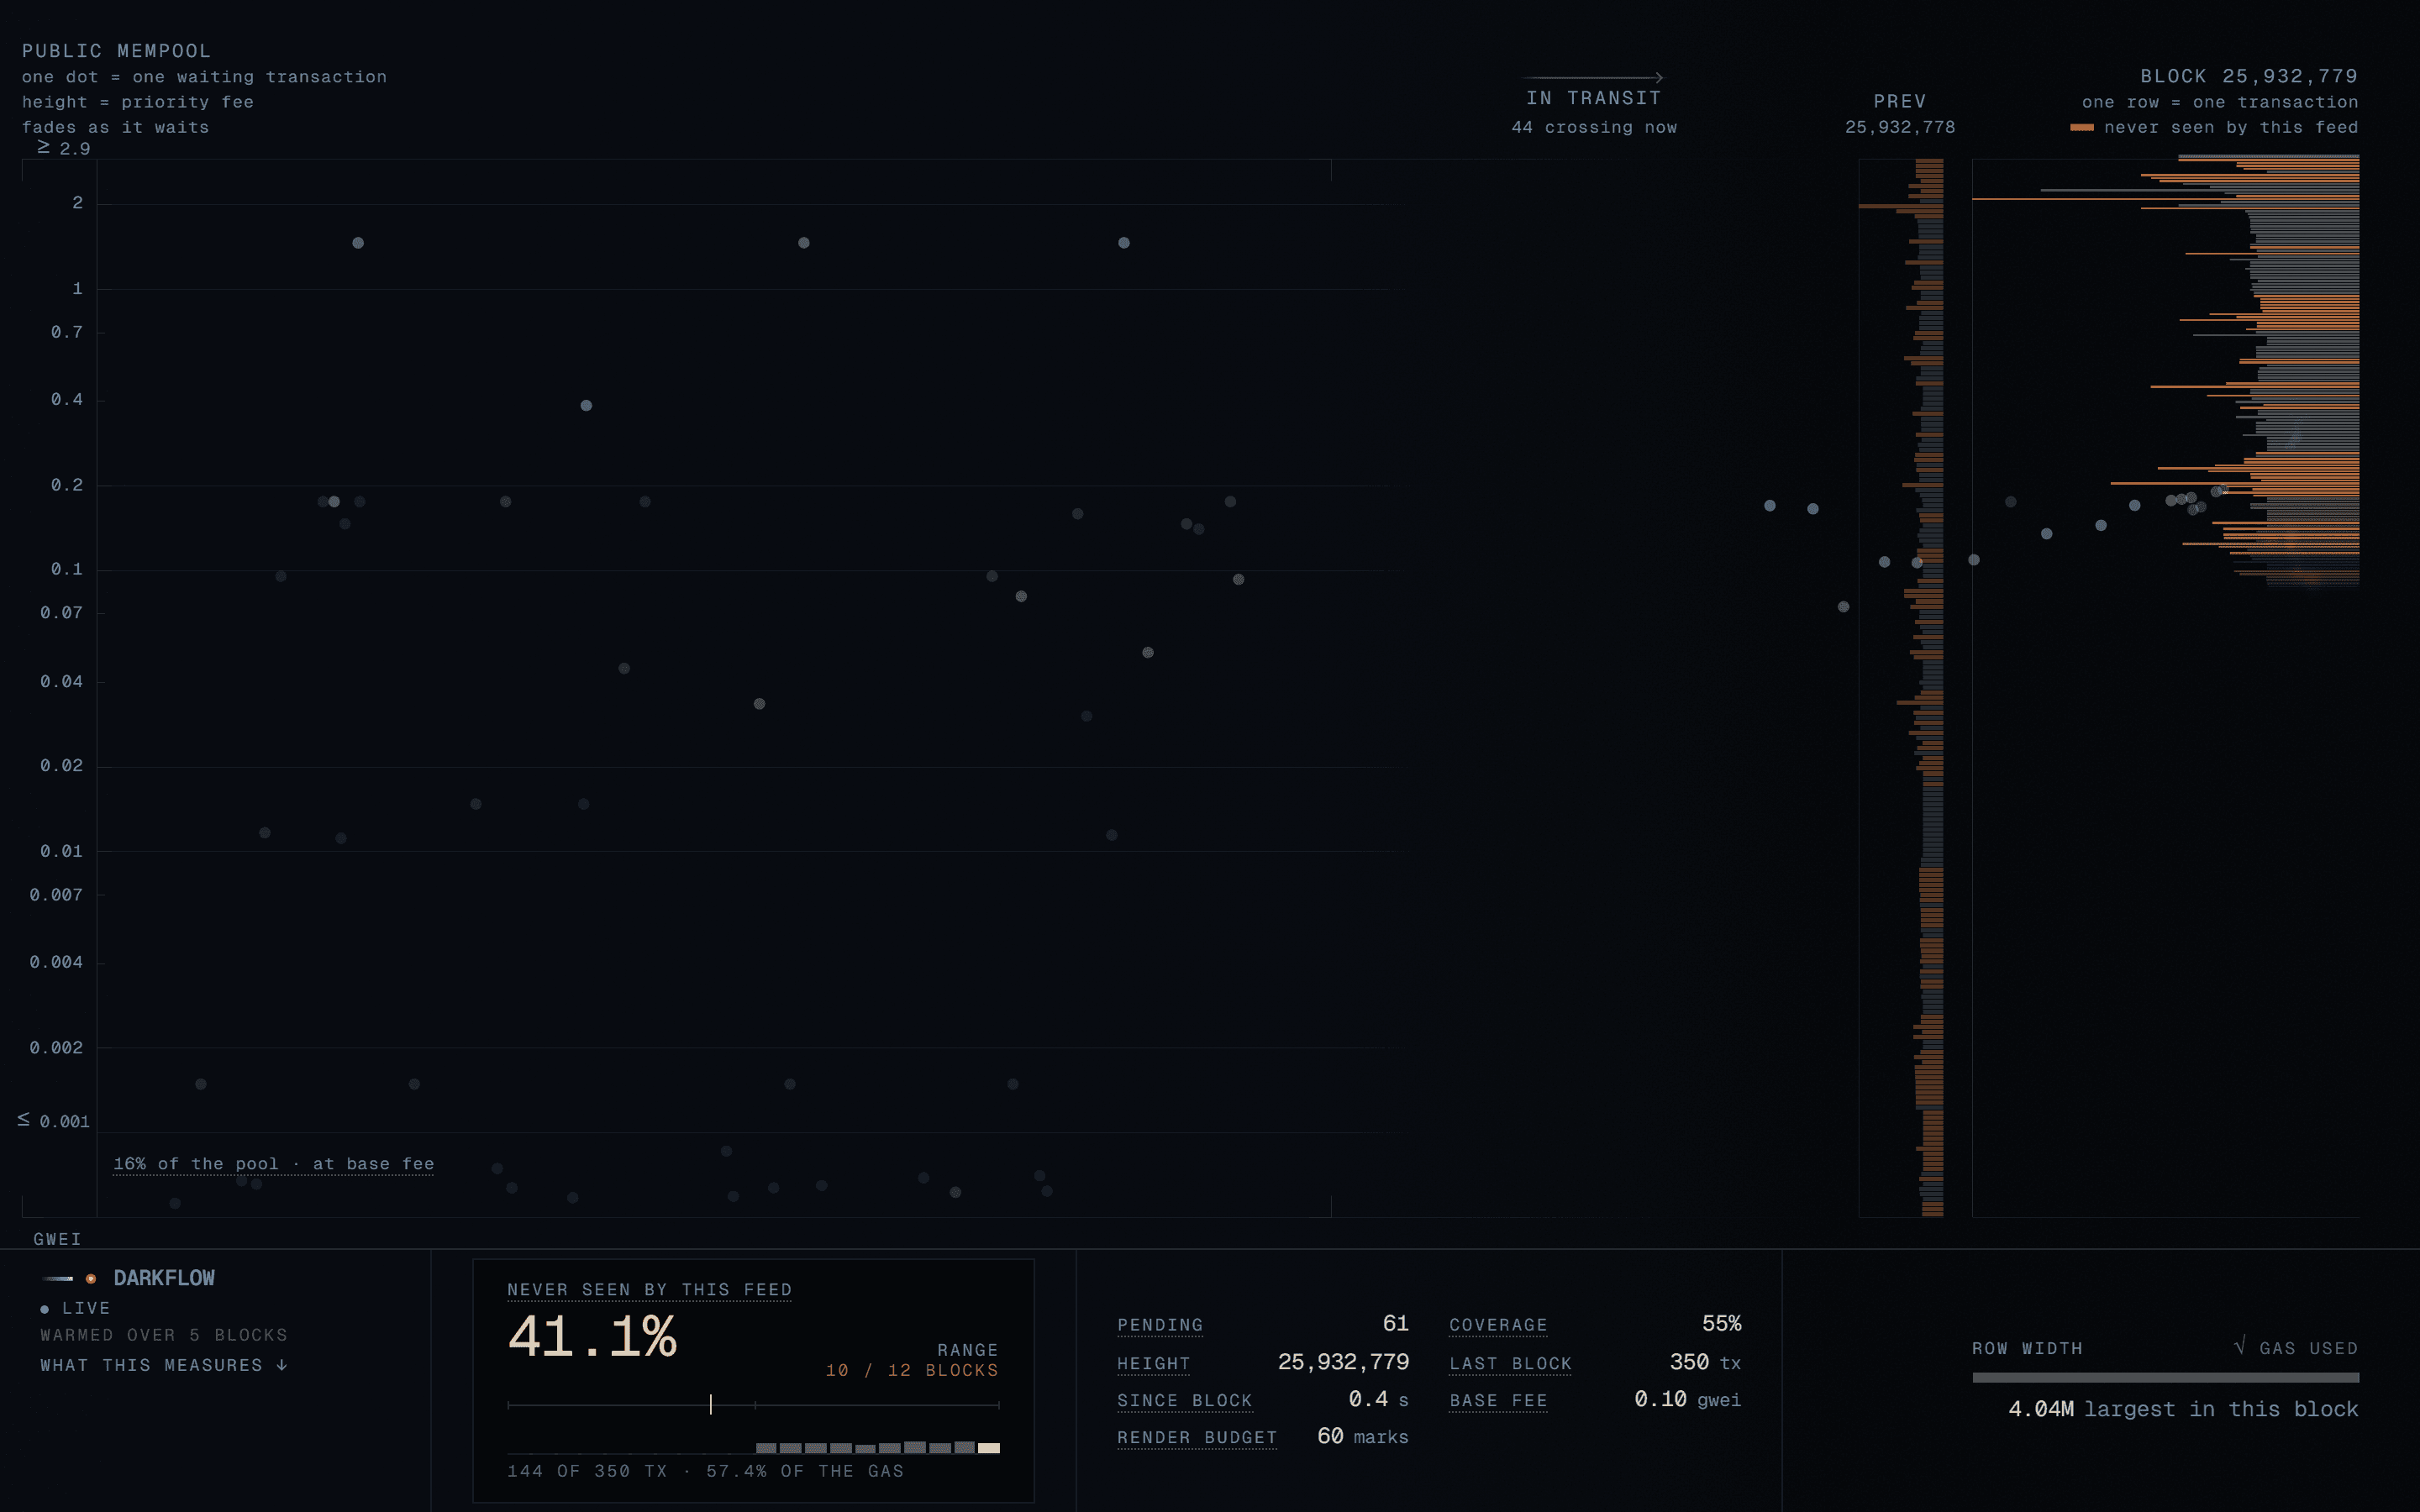
The left side is the public mempool, as one endpoint hears it. Every dot is a transaction waiting to be included. It sits at the height of the priority fee it offers, on a log axis that rescales with the market, and it fades the longer it waits. Brighter means it pays more. Dimmer means it has been waiting longer. The two never share a channel, which took longer to get right than it sounds.
The right side is the latest block, one row per transaction, each row as wide as the gas it burned.
Every twelve seconds a block lands. The transactions the feed had already heard fly from the pool to their row, and you can watch them cross. The ones it had never heard do not fly from anywhere, because they were never anywhere. They just appear in place, in amber, the one warm colour the page uses for nothing else. The panel counts them: never seen by this feed. In the screenshot that is 144 of 350.
I think of it as a cloud chamber. A track is a track. What varies is how bright it is and where it sits, and nothing else. The mark radius is constant on purpose. An earlier version scaled it with the fee, which quietly added a third fee channel on top of height and brightness. Measured on a live pool of 300, the cheapest fifth of transactions held 24 percent of the population and 7.9 percent of the ink. The picture was lying about the distribution, and it looked great.
Watch a block land
A still cannot show the part that matters. This is block 25,904,803 landing on mainnet: the public transactions crossing from the pool to their rows, and 130 of its 301 rows appearing in place with nowhere to come from.
Where the number comes from
The page keeps a record of every transaction hash the feed has announced as pending, for five minutes. When a block lands, every hash in it is checked against that record. Found means it was public. Not found means this feed never heard it.
That sounds simple, and the first three versions got it wrong in three different ways.
The record is not the render pool. The screen draws a sample of 300 transactions and evicts the cheapest to make room. The record is bounded by age and forgets the oldest. Mixing the two is the single most damaging mistake available in this codebase, because a 300-transaction sample barely overlaps a 150-transaction block, and nearly everything comes out as private flow. The first version made exactly that mistake with the flight animation. Only the fifteen expensive transactions reserved at the top ever had a mark to fly from. The other 88 percent appeared in place, which is precisely the picture of private flow.
Five minutes is not a guess either. The first version remembered hashes for three block times, and blocks reported 59 percent private against a generator that never produced more than 40. The record was forgetting transactions that were still sitting in the pool, and every one of them landed as a ghost.
And the number is blank until it is earned. For the first five blocks after connecting the page has not been listening long enough to tell a private transaction from one that was already in the pool before it arrived. Calling those private would be the largest lie this application is capable of telling. So the headline is a dash, not a zero, and every figure derived from it inherits the dash. Zero is a claim.
"Never seen by this feed" is exactly that. One public endpoint did not hear the transaction before it was included. It is an upper bound on private flow from one vantage point. It also catches whatever propagation simply missed, anything that waited longer than the five minutes the page remembers, and anything that arrived during the cold start. The panel says "never seen by this feed", not "never in the mempool", because the second is a statement about the network and the first is what was recorded.
So the page measures its own blind spot. For every block, the ingest counts how many rows it had heard first and shows the share on the panel as COVERAGE. It runs between 45 and 55 percent. Then I pointed a second public feed, one with three times the announcements, at the same blocks. The union of the two heard one point more. Whatever is left unheard is not the feed being deaf. It is private.
How it is built
Two packages, one wire contract between them, and the contract is a file that is mostly comments.
web/ is a Next.js app with a single canvas. The simulation is a pure function, step(state, dt, now), and it takes the clock as an argument instead of reading it. That means step(state, 8000, t) advances eight seconds instantly and has to produce exactly what eight seconds of real frames would have. It is what makes the whole thing testable and what makes it independent of frame rate, and those turn out to be the same property. React never sees a transaction. It renders the chrome a few times a second from sampled readings and stays out of the hot path entirely.
A governor watches both the average frame rate and the slowest single frame in each window, and cuts the render budget when either says the device is struggling. Only the render scales down. Every arrival is still classified, so the percentage a phone reports is the number a desktop reports.
ingest/ is the server half, with no server. It is a core with zero runtime dependencies that one route handler in the web imports and runs inside a single Vercel function. One WebSocket subscription to PublicNode for pending transactions and heads. One eth_getBlockReceipts per block, by hash and never by number, so a reorg between the head and the call cannot pair a replaced block's rows with a new number. Frames batched at 10 Hz. The last minute of frames kept with ids, so a page that reconnects with Last-Event-ID gets what it missed. It subscribes when the first page arrives and unsubscribes a minute after the last one leaves, because nobody is watching this all day and nothing should run all day.
The ingest does not classify, does not reconcile reorgs, does not smooth, and never invents a frame. Each of those would let a server turn an honest "we do not know" into a false "we know". It forwards heads in the order the node reports them and the client judges every one. A number above the head is a new block. The same number with the same hashes is a duplicate and counts as evidence of nothing. A number at or below the head with different hashes is the chain changing its mind, and everything from that height up is withdrawn.
The receipts also carry effectiveGasPrice, which is the only place a private transaction's bid is ever written down. So every row in the block sits at the tip it actually paid, ghosts included. A private transaction is not placed at the floor because its bid is unknown. Its bid is known, from the block.
Three sources sit behind one subscribe: a seeded synthetic generator with the shape of mainnet, a recording, and the live feed. The status dot always says which one you are looking at and the three are never mixed. If the live feed dies, the page says "no signal", waits a minute, falls back to five minutes of recorded mainnet, says so, and offers a way back.
Why a free endpoint
Every metered provider prices the mempool by message or by byte, and the mempool is the biggest stream the chain has. At a modest 25 transactions a second, Alchemy's per-byte compute units came to about a thousand dollars a month. QuickNode's per-response credits landed on a 999 dollar plan. Chainstack's one unit per event works out to 65 million a month against 3 million free. Infura's per-event credits blow through the daily allowance by breakfast. LlamaRPC, Blast, 1RPC, Ankr and Merkle refused the WebSocket without a key.
PublicNode delivers full pending transaction objects, heads and receipts for free, without a key. I probed it before choosing it. Five minutes of pending: 11.9 transactions a second, no duplicates, no disconnects. The two scripts that produced those numbers are in ingest/scripts/, and the README says to re-run them before trusting any source that has not been probed this month. PublicNode publishes no rate limits and its terms let it revoke access for any reason, so the source lives behind an interface and replacing it is one file and one config value.
Things that looked right and were not
The characteristic failure of a project like this is a picture that is plausible. Nobody reports a plausible picture. Nineteen of these are written up on the notes page, each with what the screen showed, why nothing flagged it, and how it was caught. A few of my favourites.
An alpha that was NaN. Block marks were given firstSeen = NaN, on the reasoning that a transaction never announced has no earlier sighting. A NaN reaching ctx.globalAlpha is silently ignored by the canvas, which keeps the previous alpha, and the previous alpha was a perfectly good one. Every affected mark drew at full brightness through weeks of verification screenshots that all looked fine. It was caught by measuring the decay along a scanline instead of looking at it.
A solver that could not be wrong. The easing curve is solved with Newton-Raphson and falls back to bisection. Flipping the derivative's sign, swapping its coefficients, or reversing the Newton step left the entire easing suite green, because bisection is a complete solver on its own and rescued every mistake at thirty extra evaluations per call. Mutation testing found it. The derivative is exported now and tested against a numerical one.
A block shuffled for realism. The synthetic generator interleaved private flow into the block with a Fisher-Yates shuffle, which spread it nicely and destroyed the fee ordering of everything. The block column shares its axis with the chamber next to it, so the vertical position of every row meant nothing, and nothing on screen said so. Two adjacent rows 0.18 gwei out of sequence, noticed while checking something else.
A governor that watched the average. On an emulated phone with the CPU throttled to a sixth, the field dropped two frames a second at 40 to 107 milliseconds each, while the render budget stayed exactly where it started. The governor judged a window by its mean frame rate, and the mean was 67 fps. Twenty-seven fast frames absorb one slow one. It could not see the frame a reader sees.
A build gate that read the lines it expected. The gate piped the build's output through a filter for "error", "Failed" and the success line. The build compiled, then died two steps later on "Invalid segment configuration export", which contains none of the three words. It printed "Compiled successfully" for hours. A gate is its exit code now. The output is for reading, not for deciding.
A status endpoint describing a process that was not there. First deployment. The stream delivered frames and the page went live. The same second, /api/state reported running: false and zero starts. On Vercel every route file is its own function with its own instance, and the core lives in module state. Three files were three processes, and the state endpoint was telling the truth about the wrong one. One dynamic route serves all three paths from one function now.
The rules that came out of the list are short. Everything is measured in pixels before and after a change, because eyes are what every failure above got past. Zero is a claim. Nothing is drawn that the data does not support. A green test with no dead mutant is not evidence. Measured and inferred are kept apart.
What the feed had to prove before going live
There are 399 tests in the web and 57 in the ingest, and the ones that matter are checked with mutants. A test that stays green when the code it guards is broken is not a test. But a green suite says nothing about mainnet, so the feed had to produce numbers before the dot was allowed to say live.
- Announced. 11.9 transactions a second over a five-minute probe. 14.3 a second over a twenty-minute run of the ingest, 16,850 in 1,175 seconds. Mainnet as one public endpoint hears it, not as the chain produces it.
- Coverage. About half of a block heard before it landed. 55.5 percent over fifteen blocks in the probe, 47 to 56 across the day's runs by the ingest's own count. From the host, on its first day, 42 to 61 percent block by block.
- Blocks. Every head became a block. 97 of 97 over twenty minutes, receipts had for all, none missed, none invented.
- The stream limit. Vercel closes a streamed response at 300 seconds, so the ingest ends each stream at 290 and the page reconnects with the id of the last frame it saw. A page left open on the deployed site for 340 seconds: live at 59, reconnecting at 290, live again at 291. Its block height ran through twenty-eight values, none skipped, none repeated.
Quickstart
git clone https://github.com/casaisdev/darkflow.git
cd darkflow/web
cp .env.example .env.local
pnpm install
pnpm dev
The source is picked at build time with NEXT_PUBLIC_STREAM_SOURCE. The default is synthetic, which needs no network and is what every visual constant was calibrated against. replay plays the recording in public/replay/, five minutes of mainnet from the afternoon of 2026-09-03: blocks 25,897,732 to 25,897,756, all twenty-five of them, 7,807 transactions heard from two public endpoints. sse is the live path, either /api/stream with UPSTREAM_WS_URL set on the server, or scripts/fake-ingest.mjs, a fake ingest with a control endpoint for breaking the feed on purpose.
Deploying is one Vercel project with root directory web and four environment variables. The ingest runs inside the site's functions and reads the same environment, so there is nothing else to deploy.
Notes
- A recording can be driven, because it is a record and not the chain. Pause, next block, land again, copy a link, and
?block=Nopens it at that block. A live source cannot be sped up and will not be. - A recording ends rather than loops. Block numbers going back to the start would be judged as the chain replacing twenty-five blocks, and the panel would report a reorg that never happened.
- Below the lowest rule on the axis is the floor band, for transactions offering nothing above the base fee. In the recording that is 65.8 percent of the pool, and 12 percent of those get included against 78 percent of the rest. That population is a category, not a height, so it has a band of its own instead of a dense line that reads as the edge of the instrument.
- There is no
valuefield on the wire, deliberately. Height, brightness, width and colour are all spoken for, and the amount being moved says nothing about whether a transaction passed through the public mempool. - Below 1024 px the instrument is laid out for a phone rather than shrunk from a desk. The canvas goes portrait, the panel stacks, and a tapped row opens the inspector as a sheet.
Next steps
What is still open, as the notes page lists it:
- Vercel may run more than one copy of the route handler at once, and on the first day it did. The stream is right either way, but the COVERAGE reading polls
/api/stateand can end up describing the copy next door. The fix is to carry coverage inside the stream itself. - The propagation term is measured continuously against the feed's own count and once against a second feed. It has not been measured against an independent record of the pool, which no public endpoint offers.
- Small screens are measured in emulation at 390, 430, 768 and sideways at 844 by 390. A real phone's GPU and compositor are not, and no emulation approximates them.